
TIBYAN — Business insight and monthly data interfaces
A useful reading starts with the rows behind the number. TIBYAN connects metrics to periods, branches, channels and source data, with visible coverage, conditional prior-year comparison and review before an import changes the source.
Explore the project 1 / 1
Project information
- Client
- An original Nextwave project
- Sector
- Professional services
- Platforms
- Web
- Project type
- Business systems
Services delivered
Project overview
Choosing a branch changes a report, but the important question is whether every part of the reading follows the same source and filters. Nextwave designed TIBYAN around a traceable path from monthly rows to an explainable metric and its underlying details.
A report needs definitions and visible limits to its knowledge
An absent month means missing source data;a recorded zero is an existing reading with no amount. A prior-period comparison needs a coverage check before a percentage change is shown. These details matter even when a chart looks complete.
Every chart and metric follows the rows matching the user’s selection. Row counts, recorded months and expected coverage stay visible. The reader can move from totals to a branch or channel and then to the actual rows with the calculation definition available.
A summary, an explorer and a source that can be reviewed
The summary presents revenue, cost, row margin, orders and average order value beside monthly bars and a matching prior-year period. Period, branch and channel selections persist between the summary and explorer.
The explorer breaks the reading down by branch/channel and exposes matching rows, with export across all table pages. The source page offers the full register or saved-reading scope, manual row entry, reasoned correction and CSV preview before commitment.
Explicit calculations and coverage that gives comparison meaning
Revenue, cost and orders are sums of the selected rows. Difference is revenue minus cost;margin divides that difference by revenue;average order divides revenue by order count. A zero denominator is unavailable, and negative margin remains visible when costs exceed revenue.
Expected coverage combines each month with the selected branches and channels from the source dimensions. Revenue growth appears only with complete current/prior coverage and a positive prior base. Missing months remain chart gaps, while partial coverage is explicitly labeled.
Project images
Explore the interface and experience through the project gallery.
 1 / 3
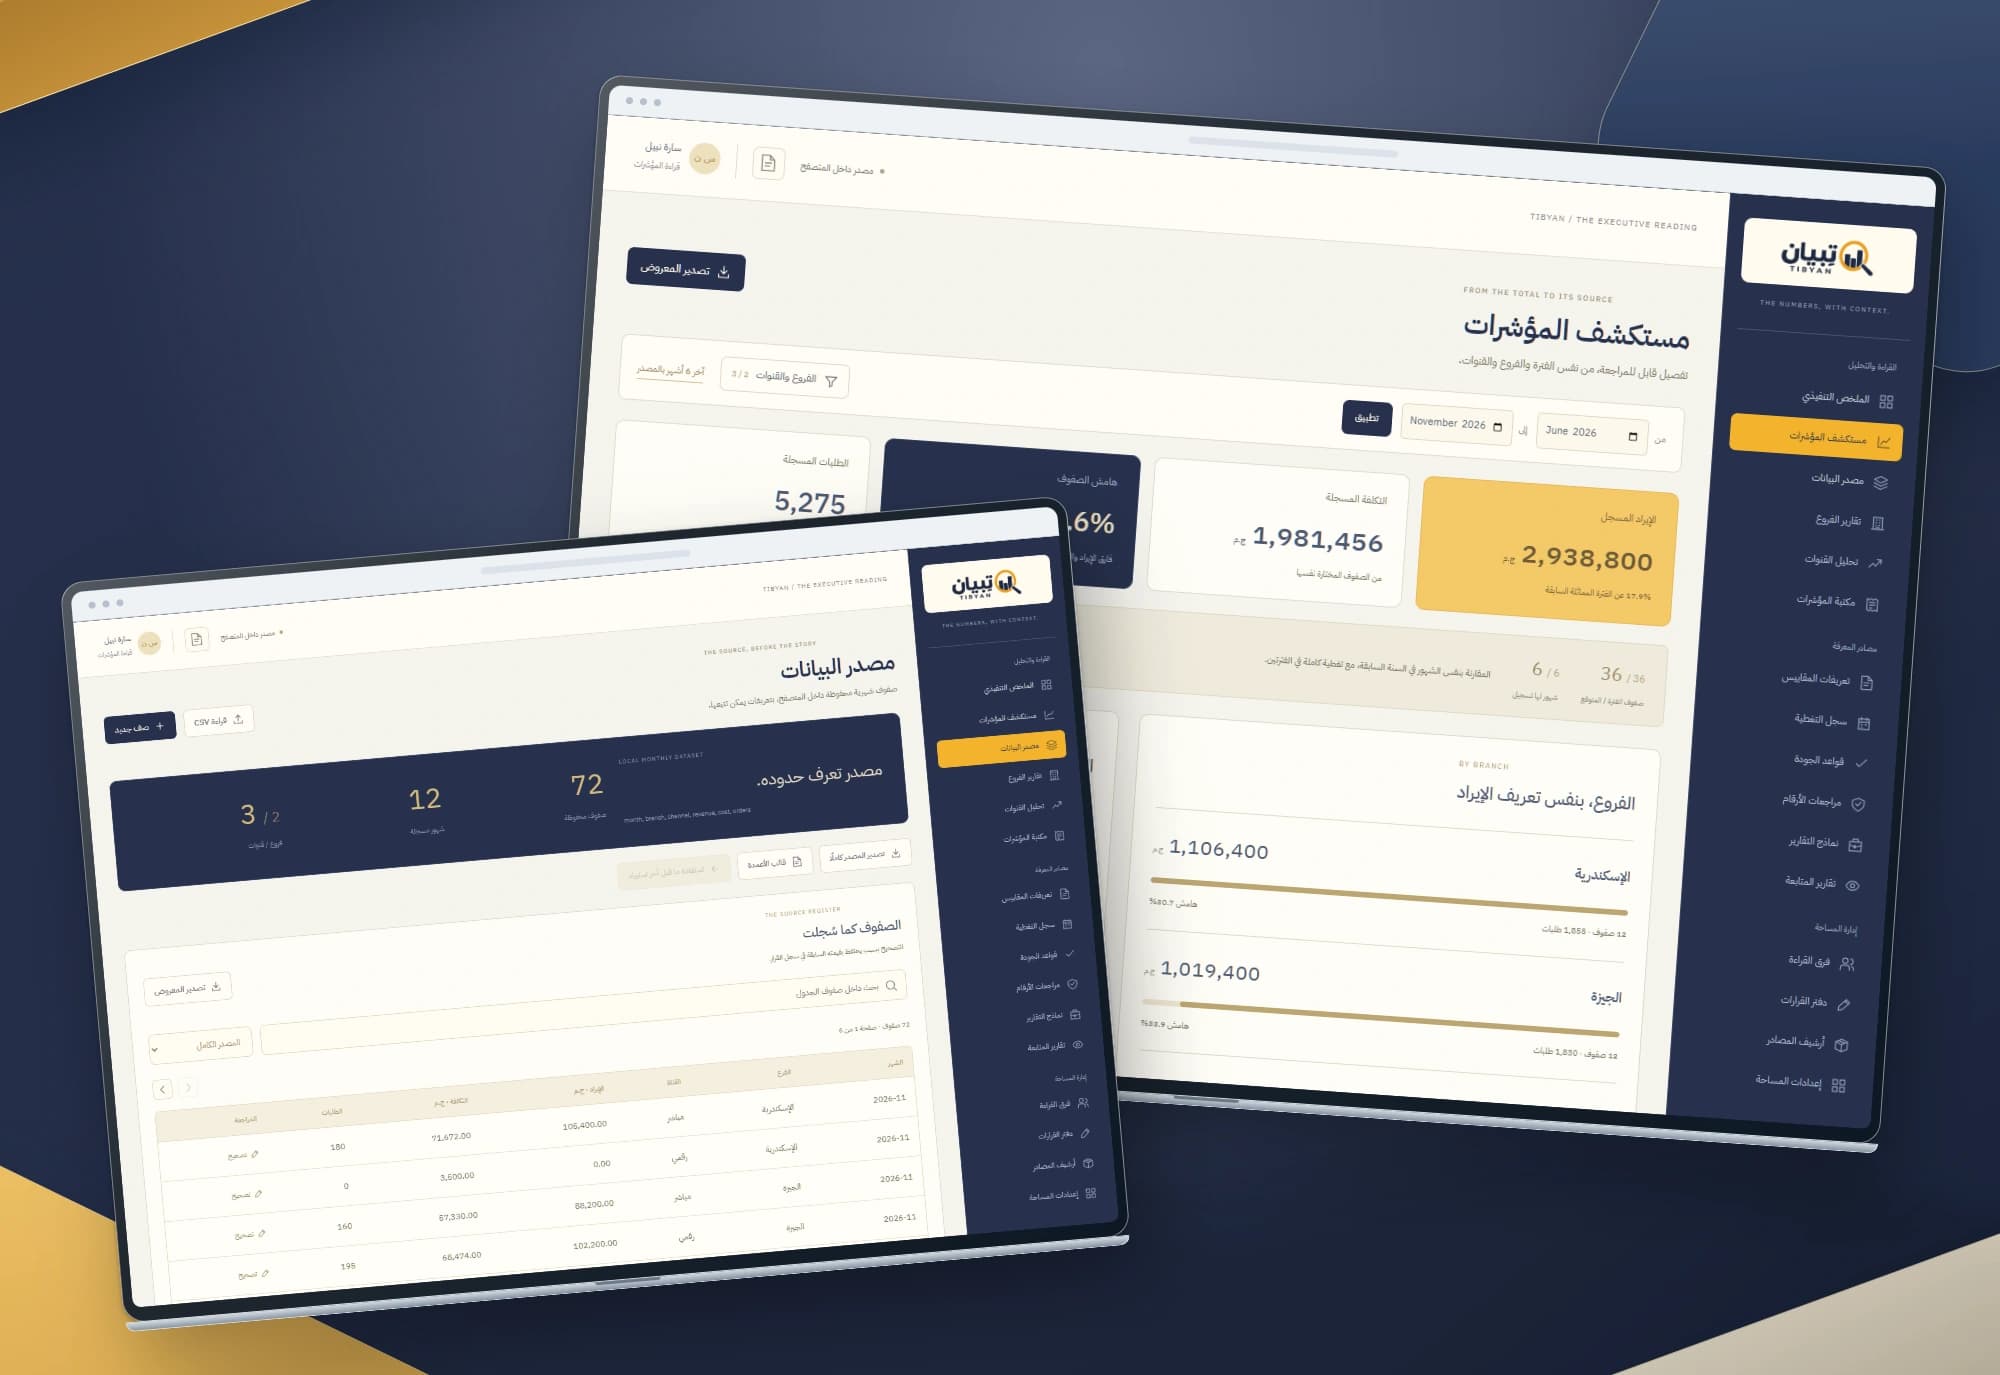
Use case: read a branch and channel from the same row set
The user sets the inclusive monthly period and chooses branches/channels. Metrics, monthly bars, breakdowns and explorer rows update together. Selecting a chart month narrows the reading, and a separate action returns to the source’s latest six months.
The matching rows explain the total, the groups explain its distribution and the table exposes its details. Visible export includes all matching rows across pagination, while a separate source export remains available from the source page.
Use case: understand why a comparison percentage is unavailable
When a month/branch/channel combination is absent, coverage shows recorded versus expected rows and distinguishes a completely missing month from a partial one. Known totals remain readable while growth waits for its comparison conditions.
A zero-revenue row remains a recorded reading. Margin or average becomes unavailable when its denominator is zero, and the source remains accessible. The reader can understand why a percentage is missing and inspect the rows the reading needs.
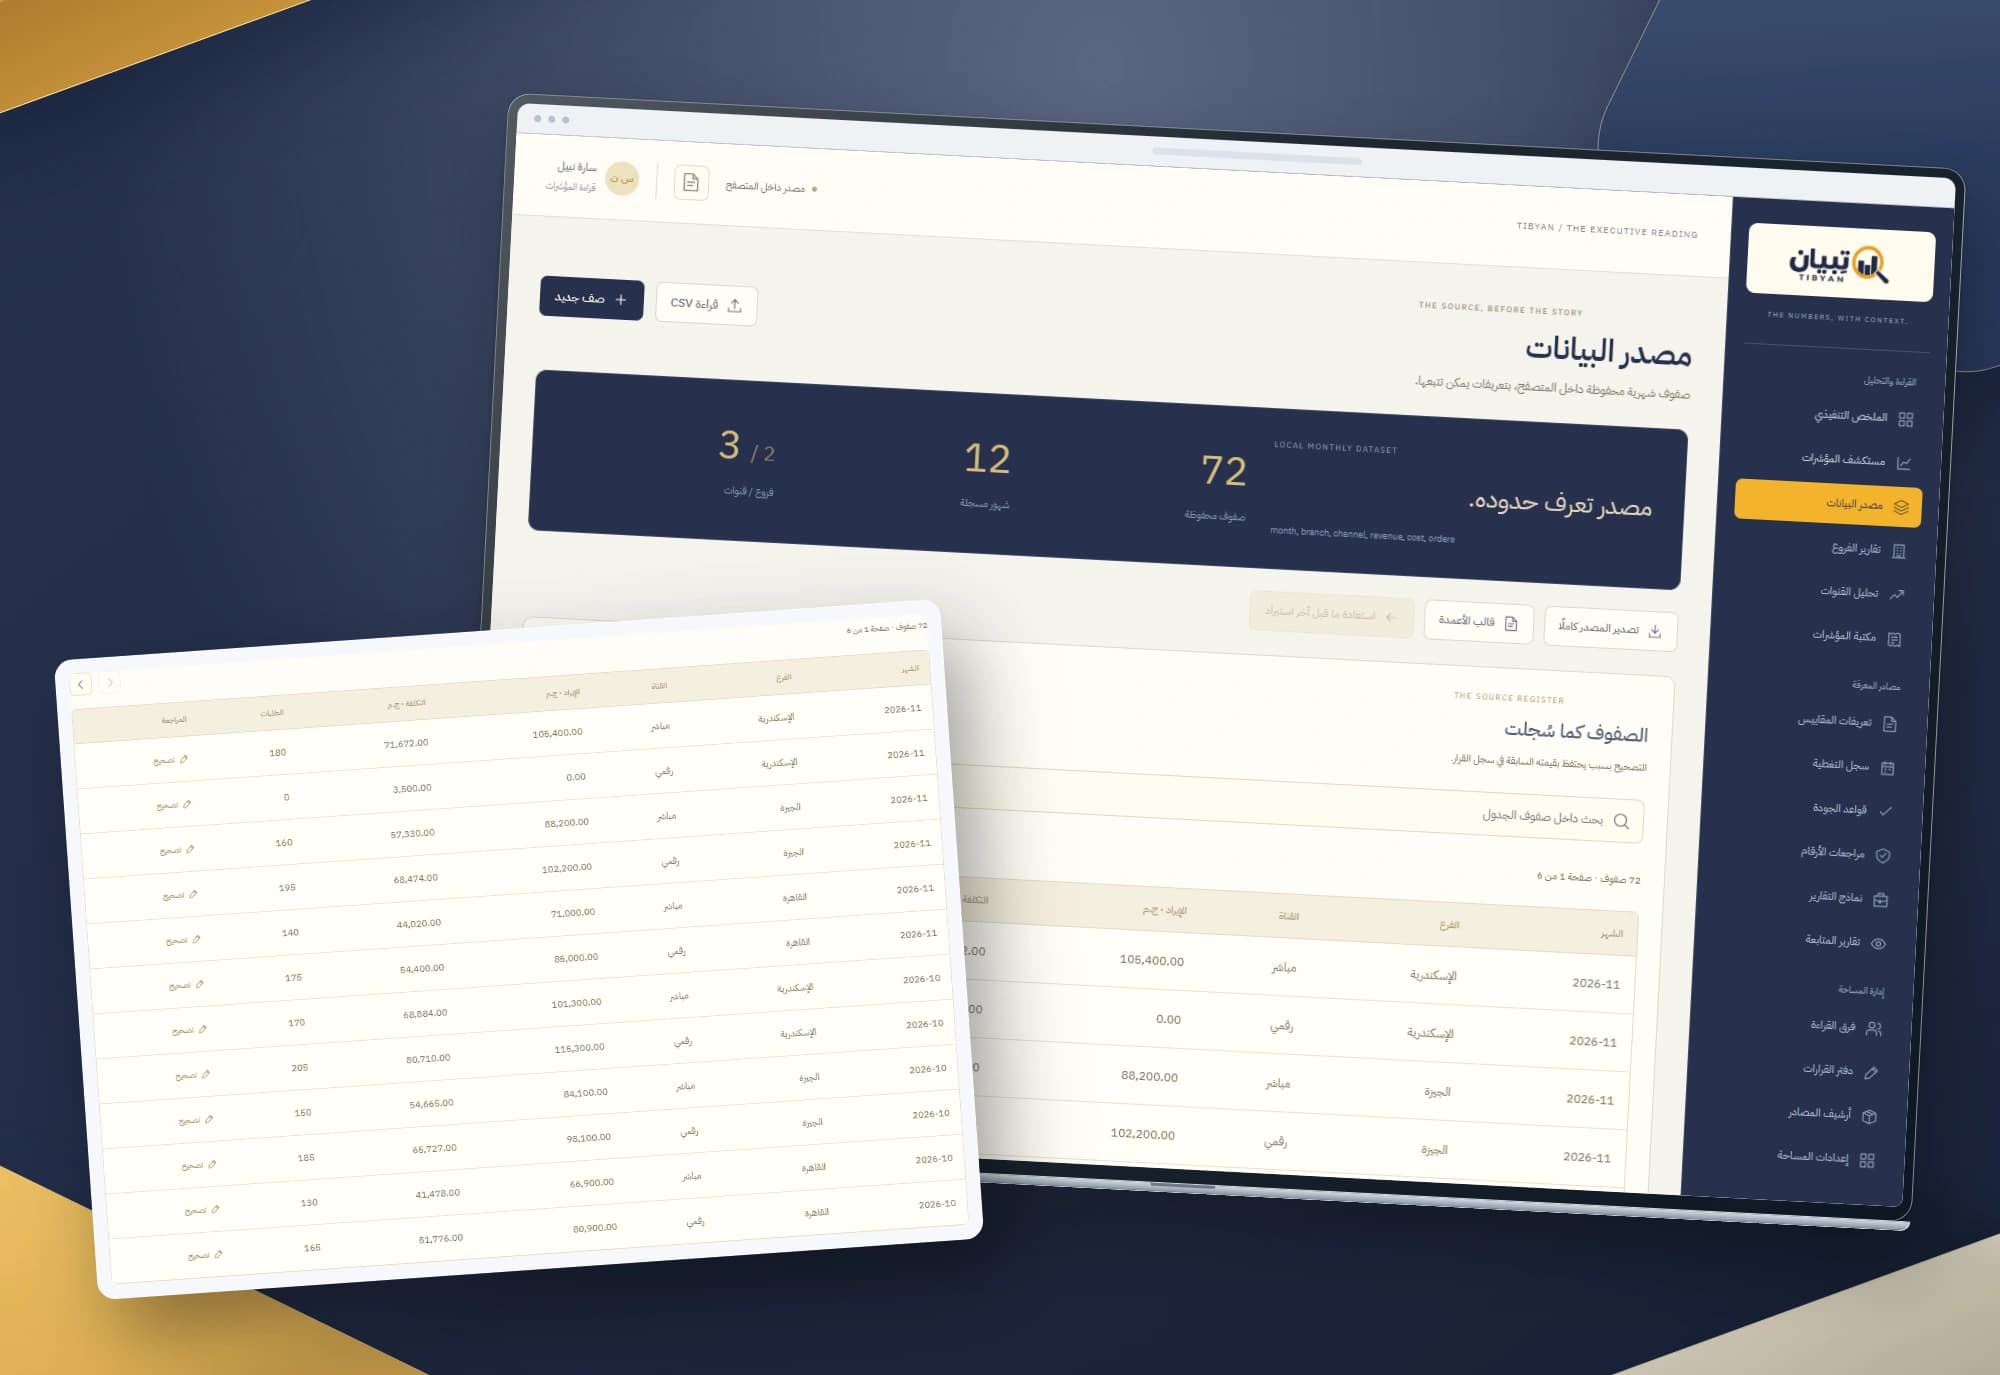
Use case: review CSV rows before changing the source
The user reads a file with the defined month, branch, channel, revenue, cost and order columns. The parser checks headers, values and duplicate keys and supports quoted commas and embedded line breaks. A preview shows row counts and conflicts without changing the current source.
Append rejects existing keys;replacement requires a reason. The operation keeps one snapshot of pre-import rows. Restore explains that current rows, including later corrections, will be replaced and the snapshot consumed while decisions remain. A failed save preserves source, preview and inputs.
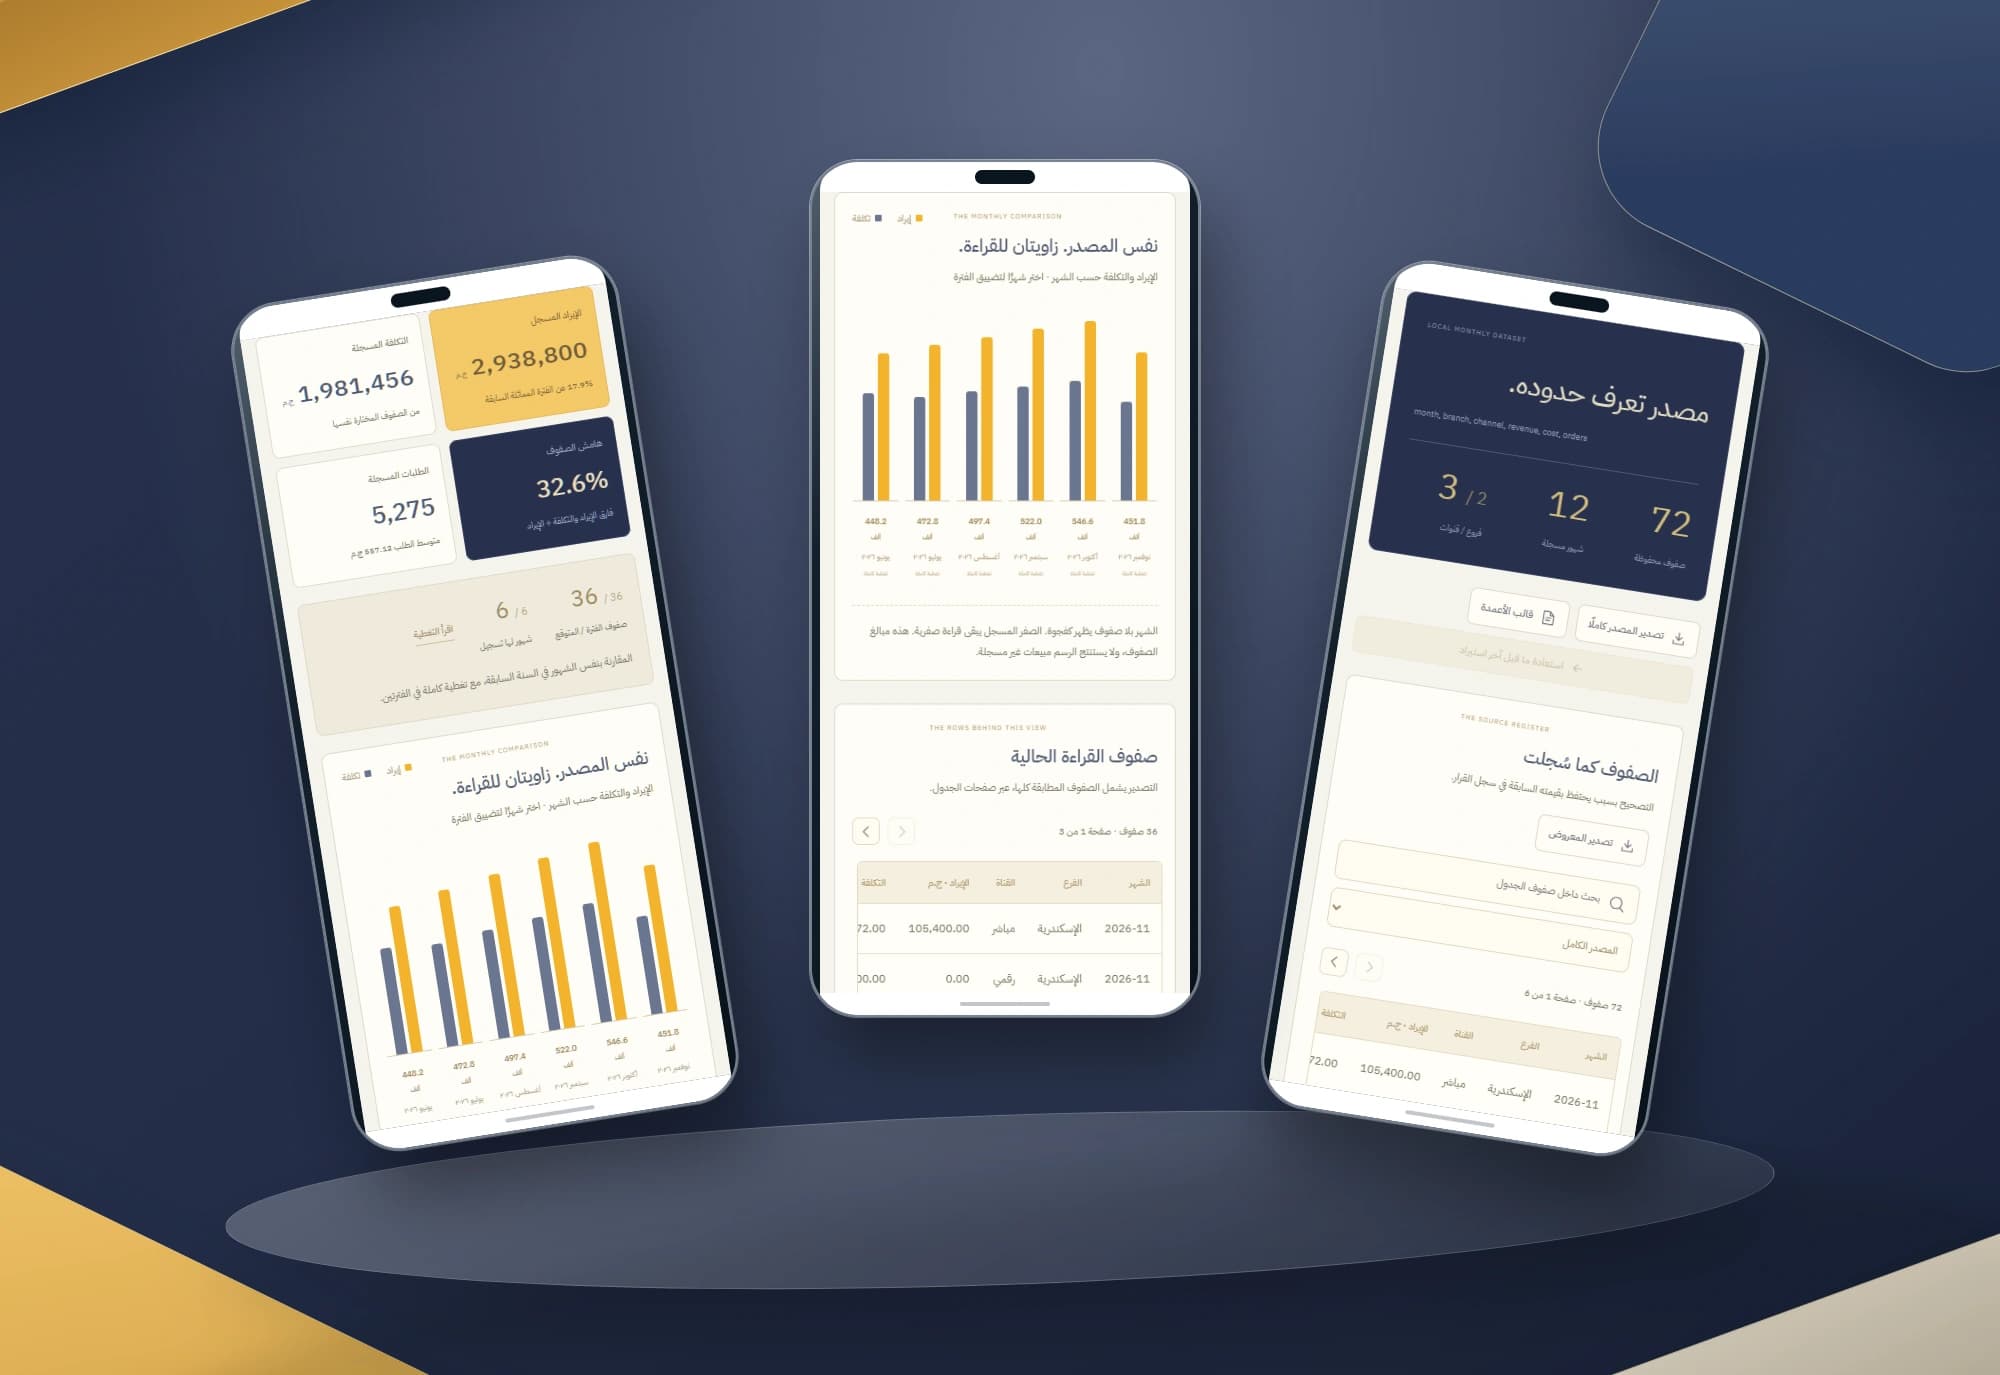
A report rhythm with two clearly distinguished bar series
Amber distinguishes revenue and key actions;navy carries context, headings and the cost series against calm ivory surfaces. Six months fit the mobile chart;longer periods scroll inside it while the page stays within the viewport.
The analyst photograph is a generated editorial asset and does not identify an employee or customer. Four mockups preserve original interface screenshots on amber/navy compositions, keeping numbers and lettering inside screens.
Implemented scope
The scope is three responsive Arabic HTML, CSS and JavaScript interfaces with browser-local persistence. Rules include integer cents, whole orders, canonical row keys, up to 24 months and 5,000 source rows. Review covers calculations, coverage, import, correction, restore, empty states, save failures, large content and keyboard use.
The source consists of local user-entered or imported rows. Servers, data warehouses, ERP, shared permissions, prediction and AI analysis require further implementation. The displayed margin is a defined row calculation, without a claim of accounting net profit or customer sales results.
Built with
- HTML5
- CSS3
- JavaScript
- localStorage

DARAJ — Employee performance and development interfaces
Performance reviews begin with people and lead to clear next steps. DARAJ connects an employee directory with individual skills, dated reviews and a development plan.
Explore project
HABR — Legal matters and office workflow interface
Dates, tasks and documents belong to the same matter. An Arabic workspace connects the office agenda to case files and notes, keeping each step in context.
Explore projectWhich daily number do you need to trace back to its source?
We start with your sources, metric definitions and comparison rules, then define the data model, permissions and integrations your team’s reading needs.